Talking Points
- End of the month will be important for the S&P 500
- Cycle turn window seen in USD/JPY near the end of the week
- GBP/USD still unable to fully breach key support level
Looking for real time Forex analysis throughout the day? Try DailyFX on Demand.
Foreign Exchange Price & Time at a Glance:
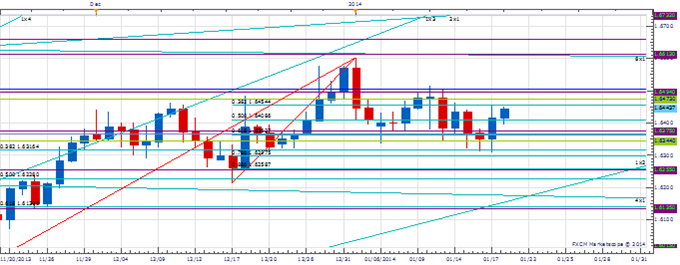
Price & Time Analysis: USD/JPY

Charts Created using Marketscope – Prepared by Kristian Kerr
- USD/JPY remains near the middle of the yea-to-date range
- Our near-term trend bias is lower in the exchange rate while below 104.80
- The 2nd square root relationship of the year’s high at 103.45 is again a near-term downside pivot, but under 102.85 is really needed to signal that a more important decline is unfolding
- The latter half of the week is an important cycle turn window
- Only a close over 104.80 would shift our near-term trend bias to positive
USD/JPY Strategy: Like the short side while below 104.80
Instrument | Support 2 | Support 1 | Spot | Resistance 1 | Resistance 2 |
USD/JPY | *102.85 | 103.35 | 104.05 | 104.45 | *104.80 |
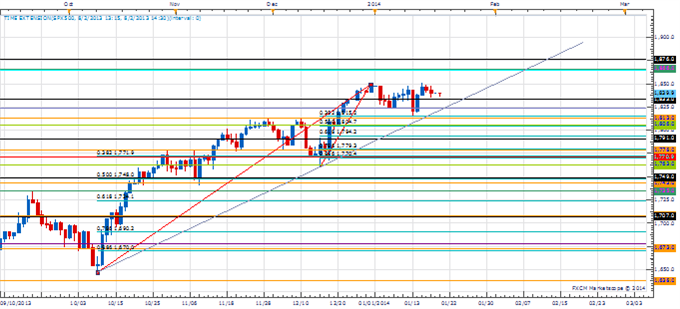
Price & Time Analysis: GBP/USD
Charts Created using Marketscope – Prepared by Kristian Kerr
- GBP/USD once again failed to close below the 2nd square root relationship of the year’s high at 1.6345 last
- Our near-term trend bias is lower in Cable while below 1.6570
- The 1.6345 level remains a critical downside pivot that must be broken to confirm that a broader move lower is indeed taking place
- A minor cycle turn window is seen on Tuesday
- On a daily close over the 2013 closing high at 1.6570 would turn us positive on the Pound
GBP/USD Strategy: We like selling into the anticipated strength over the next day or so.
Instrument | Support 2 | Support 1 | Spot | Resistance 1 | Resistance 2 |
GBP/USD | 1.6255 | *1.6345 | 1.6440 | 1.6495 | *1.6570 |
Focus Chart of the Day: S&P 500
This coming Friday commences the start of what we think will be an important two weeks for the S&P 500 and pro-risk markets in general. A variety of different cyclical techniques and methodologies all converge over this time and suggest that whatever comes out of this period (high or low) will have serious influence on the direction of markets over the first half of 2014. With positive sentiment towards equities having recently reached its highest level in three decades and the daily chart now resembling a Sornette log - we clearly favor a high. Such an occurrence probably requires more near-term strength. Important Fibonacci and Gann price relationships exist from current levels all the way up to around 1925 in the S&P 500 (though a test of the high end of this resistance area is not really favored) and mark a clear potential topping zone. Any weakness that follows this potential peak should last several months if our cyclical analysis is correct. It would take a decline of at least 3.5% in the index by early next month to seriously raise the possibility of a material low forming during this important cycle turn window.
To receive other reports from this author via e-mail, sign up to Kristian’s e-mail distribution list via this link.
--- Written by Kristian Kerr, Senior Currency Strategist for DailyFX.com
This publication attempts to further explore the concept that mass movements of human psychology, as represented by the financial markets, are subject to the mathematical laws of nature and through the use of various geometric, arithmetic, statistical and cyclical techniques a better understanding of markets and their corresponding movements can be achieved
To contact Kristian, e-mail kkerr@fxcm.com. Follow me on Twitter @KKerrFX
original source


