Launched New Products and Services, Reduced Operating Costs and Improved Financial Position
Expanded GP Solutions Program to Capitalize on Adjacent Market Growth Opportunities in Fiscal 2025
Commenting on the results, Beneficient management said: “We have built a solid platform for growth in large but underserved markets as we seek to transform the alternative asset industry with innovative new liquidity and primary capital products and services offered in a fiduciary capacity. Although our reported operating expenses during the fourth quarter increased substantially compared the prior year period, when adjusted to exclude non-cash accounting adjustments related to our loan collateral portfolio, changes in valuations of securities held in our former parent from 2020 and accrued loss contingency, fourth quarter operating performance was effectively steady from the third quarter.
“Looking ahead to Fiscal 2025, we intend to significantly expand our Preferred Liquidity Provider Program, offered through our GP Solutions group, building on our foundation that now includes 20 participating funds representing approximately
“We are also seeing increased interest from
Fourth Quarter Fiscal 2024 and Recent Highlights (for the quarter ended
- Reported investments with a fair value of
$329.1 million , from$491.9 million at the end of our prior fiscal year, which served as collateral for Ben Liquidity's net loan portfolio of$256.2 million and$366.8 million , atMarch 31, 2024 and 2023, respectively. - Grew the GP Preferred Liquidity Provider Program to 20 funds and
$1.5 billion in committed capital compared to 7 participating funds with$300 million in committed capital atDecember 31, 2022 . - Operating expenses were
$151.9 million in the fourth quarter of 2024, which includes a non-cash goodwill impairment of$68.1 million and a recognized loss contingency totaling$55.0 million , resulting in$28.8 million of operating expenses, excluding the goodwill impairment and loss contingency, compared with$30.5 million of operating expenses in the same period of 2023, which represents an increase of 498%. - Operating expenses declined by 6% in the fourth quarter of 2024 when excluding non-cash loss on impairment of goodwill and the recognized loss contingency, as compared with the prior year fourth quarter.
- GP Solutions capability evolved and closed
$2 million of liquidity financings during 4Q24, capping nearly$10 million sourced from GP Preferred Liquidity Provider Program. - Announced termination of the previously issued Wells Notice letters issued to the Company with no recommendation of enforcement action.
- Announced board approval for the launch of a new ExchangeTrust Product Plan to further facilitate market adoption of Ben’s fiduciary products and services by completing up to
$5 billion of fiduciary financings to Customer ExAlt Trusts through ExchangeTrust transactions using an automated formula-based pricing model intended to achieve a stockholder-accretive risk-adjusted return and ultimately reduce transaction closing times to as little as 15 days.
“Ben is designed to fill what we believe to be an increasingly critical market need as the ownership of alternative investments continues to grow across mid-to-high net worth individual investors and small-to-midsize institutional investors. During this fiscal year we are focused on improving our ability to deliver these solutions through expansion of our capital base. Our AltAccess platform uniquely provides price, cost, and time certainty within a fully integrated offering of fiduciary products and services through our fiduciary financial trust company chartered subsidiary,” continued Ben management.
“Our expanded GP Solutions offering is also gaining interest, and in particular our GP Primary Commitment Program, through which Ben offers its financing products and other trust services to GPs who are currently fund raising. These financings, if completed, would further diversify Ben’s existing loan collateral portfolio across an even wider array of managers, asset classes, industry sectors and geographies.”
Loan Portfolio
As a result of executing on our business plan of providing financing for liquidity, or early investment exits, for alternative asset marketplace participants, Ben organically develops a balance sheet comprised largely of loans collateralized by a well- diversified alternative asset portfolio that is expected to grow as Ben successfully executes on its core business.
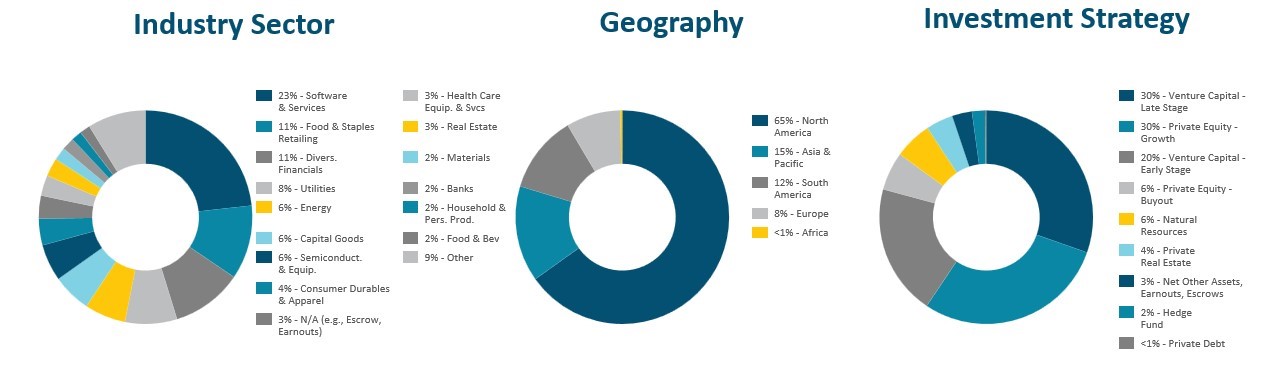
Ben’s balance sheet strategy for ExAlt Loan origination is built on the theory of the portfolio endowment model for the fiduciary financings we make by utilizing our patent-pending computer implemented technologies branded as OptimumAlt. Our OptimumAlt endowment model balance sheet approach guides diversification of our fiduciary financings across seven asset classes of alternative assets, over 11 industry sectors in which alternative asset managers invest, and at least six countrywide exposures and multiple vintages of dates of investment into the private funds and companies.
At
Figure 1: Portfolio Diversification
Diversification Using Principal Loan Balance, Net of Allowance for Credit Losses
As of
As of
Business Segments: Fourth Quarter Fiscal 2024
Ben Liquidity
Ben Liquidity offers simple, rapid and cost-effective liquidity products through the use of our proprietary financing and trust structure, or the “Customer ExAlt Trusts,” which facilitate the exchange of a Customer’s alternative assets for consideration.
- Ben Liquidity recognized
$10.6 million of interest income for the fiscal fourth quarter, down 5.6% from the quarter endedDecember 31, 2023 , primarily due to lower carrying value of loan receivables, driven by higher allowance for credit losses. - Operating loss for the fiscal fourth quarter was
$29.4 million , compared to an operating loss of$606.4 million for the quarter endedDecember 31, 2023 . The quarter endedDecember 31, 2023 included non-cash goodwill impairment of$604.7 million while the fiscal fourth quarter operating loss included increased credit loss adjustments, principally related to a decrease in the collateral value associated with one transaction originated during the current fiscal year. - Adjusted operating loss(1) for the fiscal fourth quarter was
$29.4 million , compared to adjusted operating income(1) of$2.5 million in the quarter endedDecember 31, 2023 . The decrease was primarily due to higher credit loss adjustments related to one transaction, which originated during the current fiscal year partially offset by lower credit loss adjustments related to securities of our former parent company in the fiscal fourth quarter.
Ben Custody
Ben Custody provides full-service trust and custody administration services to the trustees of certain of the Customer ExAlt Trusts and external parties, which own the exchanged alternative assets following liquidity transactions in exchange for fees payable quarterly.
- Net asset value (“NAV”) of alternative assets and other securities held in custody by Ben Custody was
$381.2 million as ofMarch 31, 2024 , compared to$491 .9 million as ofMarch 31, 2023 . The decrease was driven by unrealized losses on existing assets, principally related to interests in a wind down trust for a bankrupt entity, and distributions, which was partially offset by new liquidity transactions of Ben Liquidity of$50 .1 million during the current fiscal year, representing 10.2% of NAV as ofMarch 31, 2023 . However, approximately$37.7 million of the NAV originated during the current fiscal year was written off during the year endedMarch 31, 2024 . - Revenues applicable to Ben Custody were
$5 .6 million for the fourth fiscal quarter, compared to$5.9 million for the quarter endedDecember 31, 2023 . The decrease was a result of lower NAV of alternative assets and other securities held in custody. - Operating loss for the fourth fiscal quarter was
$50.0 million , compared to an operating loss of$268.0 million for the quarter endedDecember 31, 2023 . The decrease in operating loss was primarily due to lower non-cash goodwill impairment in the fourth fiscal quarter of$28 .7 million compared to$272.8 million in the quarter endedDecember 31, 2023 . Additionally, in the fourth fiscal quarter, we recognized$25 .5 million provision for credit losses in the current fiscal year related to accrued fees collateralized by securities of our former parent company, compared to no such credit losses in the quarter endedDecember 31, 2023 . - Adjusted operating income(1) for the fourth fiscal quarter was
$4 .0 million, compared to adjusted operating income(1) of$4.8 million for the quarter endedDecember 31, 2023 . The decrease was primarily due to a change in revenue due to lower NAV of alternative assets and other securities held in custody during the fourth fiscal quarter.
Business Segments: Year Ended Fiscal 2024
Ben Liquidity
- Ben Liquidity recognized
$46.9 million of interest income for the year endedMarch 31, 2024 , down 7.6% compared to the year endedMarch 31, 2023 , primarily due to lower loans, net of the allowance for credit losses, resulting from higher levels of non-accrual loans and loan prepayments, partially offset by new loans originated. - Operating loss was
$1.8 billion for the year endedMarch 31, 2024 compared to an operating loss of$46.5 million in the prior year period. The current period loss was driven by non-cash goodwill impairment totaling$1.7 billion and credit losses largely related to securities of our former parent company. - Adjusted operating loss(1) was
$41.2 million for the year endedMarch 31, 2024 compared to adjusted operating income(1) of$9.7 million in the prior year period with the decrease in adjusted operating income (loss)(1) primarily related to higher credit loss adjustments related to one transaction originated during the current fiscal year offset partially by lower credit loss adjustments related to securities of our former parent company recognized in the current fiscal year and additional interest expense. - New liquidity transactions closed during the year ended
March 31, 2024 included collateral with a NAV of$50 .1 million. However, loans supported by approximately$37.7 million of the NAV originated during the current fiscal year were written off during the year endedMarch 31, 2024 .
Ben Custody
- Ben Custody revenues were
$24.5 million for the year endedMarch 31, 2024 , down 15.5%, as compared to the prior year period due to lower NAV of alternative assets and other securities held in custody. - Operating loss was
$588.8 million for the year endedMarch 31, 2024 compared to operating income of$24.0 million in the prior year period, with the decrease in operating income principally related to non-cash goodwill impairment of$583.3 million and$25 .5 million provision for credit losses in the current fiscal year related to accrued fees collateralized by securities of our former parent company in the current fiscal year. - Adjusted operating income(1) for the year ended
March 31, 2024 was$19 .8 million, compared to adjusted operating income(1) of$24 .0 million in the prior year period with the decrease in adjusted operating income(1) due to lower revenue related to lower NAV of alternative assets and other securities held in custody and slightly lower professional service expense during the current fiscal year.
Legal Updates
- On
July 1, 2024 , the Company and key members of its leadership received termination letters from theSEC advising the Company thatSEC has concluded the investigation related to the Company andMr. Heppner and does not intend to recommend an enforcement action by theSEC under the previously issued Wells Notices. - On
May 22, 2024 a Federal Judge in theUnited States District Court for the Eastern District of Texas ruled against a motion to dismiss Beneficient’s lawsuit against theWall Street Journal and its reportedAlexander Gladstone for defamation, noting “the article repeatedly juxtaposes facts and uses provocative language in ways to convey the defamatory gist identified by Plaintiffs” and that Beneficient “repeatedly notified Gladstone of specific factual errors in the article and that Gladstone nevertheless rejected or ignored their corrections to serve his preconceived agenda.”
Capital and Liquidity
- As of
March 31, 2024 , the Company had cash and cash equivalents of$7.9 million and total debt of$120.5 million . - Distributions received from alternative assets and other securities held in custody totaled
$46.3 million for the year endedMarch 31, 2024 compared to$85.0 million for the prior year period. - Total investments (at fair value) of
$329.1 million atMarch 31, 2024 supported Ben Liquidity's loan portfolio.
(1) Represents a non-GAAP financial measure. For reconciliations of our non-GAAP measures to the most directly comparable GAAP financial measures and for the reasons we believe the non-GAAP measures provide useful information, see Non-GAAP Reconciliations.
Consolidated Fiscal Fourth Quarter Results
Table 1 below presents a summary of selected unaudited consolidated operating financial information.
| Consolidated Fiscal Fourth Quarter Results ($ in thousands, except share and per share amounts) | Fiscal 4Q24 2024 | Fiscal 3Q24 December 31, 2023 | Fiscal 4Q23 2023 | Change % vs. Prior Quarter | YTD Fiscal 2024 | YTD Fiscal 2023 | Change % vs. Prior YTD | |||||||||||||
| GAAP Revenues | $ | (42,957 | ) | $ | (10,235 | ) | $ | (18,468 | ) | NM | $ | (98,696 | ) | $ | (104,903 | ) | 5.9 | % | ||
| Adjusted Revenues(1) | (39,717 | ) | 8,456 | (17,976 | ) | NM | (31,239 | ) | (41,367 | ) | 24.5 | % | ||||||||
| GAAP Operating Loss | (194,861 | ) | (915,951 | ) | (49,015 | ) | 78.7 | % | (2,648,546 | ) | (253,172 | ) | NM | |||||||
| Adjusted Operating Loss(1) | (58,434 | ) | (11,684 | ) | (42,874 | ) | NM | (115,808 | ) | (143,872 | ) | 19.5 | % | |||||||
| Diluted Class A EPS | $ | (673.31 | ) | $ | (52.57 | ) | NM | |||||||||||||
| Segment Revenues attributable to Ben's Equity Holders(2) | 16,273 | 17,961 | 17,282 | (9.4) | % | 69,988 | 63,969 | 9.4 | % | |||||||||||
| Adjusted Segment Revenues attributable to Ben's Equity Holders (1)(2) | 16,306 | 18,146 | 17,381 | (10.1) | % | 71,365 | 76,844 | (7.1) | % | |||||||||||
| Segment Operating Income (Loss) attributable to Ben's Equity Holders | (195,051 | ) | (894,617 | ) | (36,767 | ) | 78.2 | % | (2,609,944 | ) | (135,311 | ) | NM | |||||||
| Adjusted Segment Operating Loss attributable to Ben's Equity Holders(1)(2) | $ | (36,544 | ) | $ | (4,594 | ) | $ | (12,648 | ) | NM | $ | (74,127 | ) | $ | (33,074 | ) | NM | |||
NM - Not meaningful.
(1) Adjusted Revenues, Adjusted Operating Income (Loss), Adjusted Segment Revenues attributable to Ben's Equity Holders and Adjusted Segment Operating Income (Loss) attributable to Ben's Equity Holders are non-GAAP financial measures. For reconciliations of our non-GAAP measures to the most directly comparable GAAP financial measures and for the reasons we believe the non-GAAP measures provide useful information, see Non-GAAP Reconciliations.
(2) Segment financial information attributable to Ben’s equity holders is presented to provide users of our financial information an understanding and visual aide of the segment information (revenues, operating income (loss), and adjusted operating income (loss)) that impacts Ben’s Equity Holders. Ben’s Equity Holders refers to the holders of Beneficient Class A and Class B common stock and Series B-1 Preferred Stock as well as holders of interests in BCH which represent noncontrolling interests. For a description of noncontrolling interests, see Item 7 of our Annual Report on Form 10-K for the year ended
Table 2 below presents a summary of selected unaudited consolidated balance sheet information.
| Consolidated Fiscal Third Quarter Results ($ in thousands) | Fiscal 4Q24 As of | Fiscal 4Q23 As of | Change % | |||||
| Investments, at Fair Value | $ | 329,119 | $ | 497,221 | (33.8) | % | ||
| All Other Assets | 22,676 | 42,448 | (46.6) | % | ||||
| 16,706 | 2,371,026 | (99.3) | % | |||||
| Total Assets | $ | 368,501 | $ | 2,910,695 | (87.3) | % | ||
Business Segment Information Attributable to Ben's Equity Holders(1)
Table 3 below presents unaudited segment revenues and segment operating income (loss) for business segments attributable to Ben's equity holders.
| Segment Revenues Attributable to Ben's Equity Holders(1) ($ in thousands) | Fiscal 4Q24 2024 | Fiscal 3Q24 December 31, 2023 | Fiscal 4Q23 2023 | Change % vs. Prior Quarter | YTD Fiscal 2024 | YTD Fiscal 2023 | Change % vs. Prior YTD | |||||||||||
| Ben Liquidity | $ | 10,644 | $ | 11,275 | $ | 12,899 | (5.6) | % | $ | 46,947 | $ | 50,819 | (7.6) | % | ||||
| Ben Custody | 5,573 | 5,897 | 6,762 | (5.5) | % | 24,534 | 29,042 | (15.5) | % | |||||||||
| Corporate & Other | 56 | 789 | (2,379 | ) | (92.9) | % | (1,493 | ) | (15,892 | ) | 90.6 | % | ||||||
| Total Segment Revenues Attributable to Ben's Equity Holders(1) | $ | 16,273 | $ | 17,961 | $ | 17,282 | (9.4) | % | $ | 69,988 | $ | 63,969 | 9.4 | % | ||||
| Segment Operating Income (Loss) Attributable to Ben's Equity Holders(1) ($ in thousands) | Fiscal 4Q24 2024 | Fiscal 3Q24 December 31, 2023 | Fiscal 4Q23 2023 | Change % vs. Prior Quarter | YTD Fiscal 2024 | YTD Fiscal 2023 | Change % vs. Prior YTD | ||||||||||||
| Ben Liquidity | $ | (29,443 | ) | $ | (606,405 | ) | $ | (18,861 | ) | 95.1 | % | $ | (1,810,964 | ) | $ | (46,512 | ) | NM | |
| Ben Custody | (49,971 | ) | (267,995 | ) | 5,726 | 81.4 | % | (588,811 | ) | 24,046 | NM | ||||||||
| Corporate & Other | (115,637 | ) | (20,217 | ) | (23,632 | ) | NM | (210,169 | ) | (112,845 | ) | (86.2)% | |||||||
| Total Segment Operating Income (Loss) Attributable to Ben's Equity Holders(1) | $ | (195,051 | ) | $ | (894,617 | ) | $ | (36,767 | ) | 78.2 | % | $ | (2,609,944 | ) | $ | (135,311 | ) | NM | |
NM - Not meaningful.
(1) Segment financial information attributable to Ben’s equity holders is presented to provide users of our financial information an understanding and visual aide of the segment information (revenues, operating income (loss), and adjusted operating income (loss)) that impacts Ben’s Equity Holders. Ben’s Equity Holders refers to the holders of Beneficient Class A and Class B common stock and Series B Preferred Stock as well as holders of interests in BCH which represent noncontrolling interests. For a description of noncontrolling interests, see Item 7 of our Annual Report on Form 10-K for the year ended
Adjusted Business Segment Information Attributable to Ben's Equity Holders(2)
Table 4 below presents unaudited adjusted segment revenue and adjusted segment operating income (loss) for business segments attributable to Ben's equity holders.
| Adjusted Segment Revenues Attributable to Ben's Equity Holders(1)(2) ($ in thousands) | Fiscal 4Q24 2024 | Fiscal 3Q24 December 31, 2023 | Fiscal 4Q23 2023 | Change % vs. Prior Quarter | YTD Fiscal 2024 | YTD Fiscal 2023 | Change % vs. Prior YTD | |||||||||||
| Ben Liquidity | $ | 10,644 | $ | 11,275 | $ | 12,899 | (5.6)% | $ | 46,947 | $ | 50,819 | (7.6)% | ||||||
| Ben Custody | 5,573 | 5,897 | 6,762 | (5.5)% | 24,534 | 29,042 | (15.5)% | |||||||||||
| Corporate & Other | 89 | 974 | (2,280 | ) | (90.9)% | (116 | ) | (3,017 | ) | 96.2% | ||||||||
| Total Adjusted Segment Revenues Attributable to Ben's Equity Holders(1)(2) | $ | 16,306 | $ | 18,146 | $ | 17,381 | (10.1)% | $ | 71,365 | $ | 76,844 | (7.1)% | ||||||
| Adjusted Segment Operating Income (Loss) Attributable to Ben's Equity Holders(1)(2) ($ in thousands) | Fiscal 4Q24 2024 | Fiscal 3Q24 December 31, 2023 | Fiscal 4Q23 2023 | Change % vs. Prior Quarter | YTD Fiscal 2024 | YTD Fiscal 2023 | Change % vs. Prior YTD | |||||||||||||
| Ben Liquidity | $ | (29,408 | ) | $ | 2,525 | $ | (490 | ) | NM | $ | (41,177 | ) | $ | 9,693 | NM | |||||
| Ben Custody | 3,997 | 4,835 | 5,726 | (17.3)% | 19,764 | 24,046 | (17.8)% | |||||||||||||
| Corporate & Other | (11,133 | ) | (11,954 | ) | (17,884 | ) | 6.9% | (52,714 | ) | (66,813 | ) | 21.1% | ||||||||
| Total Adjusted Segment Operating Income (Loss) Attributable to Ben's Equity Holders(1)(2) | $ | (36,544 | ) | $ | (4,594 | ) | $ | (12,648 | ) | NM | $ | (74,127 | ) | $ | (33,074 | ) | NM | |||
NM - Not meaningful.
(1) Adjusted Revenues, Adjusted Operating Income (Loss), Adjusted Segment Revenues attributable to Ben's Equity Holders and Adjusted Segment Operating Income (Loss) attributable to Ben's Equity Holders are non-GAAP financial measures. For reconciliations of our non-GAAP measures to the most directly comparable GAAP financial measures and for the reasons we believe the non-GAAP measures provide useful information, see Non-GAAP Reconciliations.
(2) Segment financial information attributable to Ben’s equity holders is presented to provide users of our financial information an understanding and visual aide of the segment information (revenues, operating income (loss), and adjusted operating income (loss)) that impacts Ben’s Equity Holders. Ben’s Equity Holders refers to the holders of Beneficient Class A and Class B common stock and Series B Preferred Stock as well as holders of interests in BCH which represent noncontrolling interests. For a description of noncontrolling interests, see Item 7 of our Annual Report on Form 10-K for the year ended
Reconciliation of Business Segment Information Attributable to Ben's Equity Holders to Net Income (Loss) Attributable to Ben Common Shareholders
Table 5 below presents reconciliation of operating income (loss) by business segment attributable to Ben's Equity Holders to net income (loss) attributable to Ben common shareholders.
| Reconciliation of Business Segments to Net Income (Loss) Attributable to Ben Common Shareholders ($ in thousands) | Fiscal 4Q24 2024 | Fiscal 3Q24 December 31, 2023 | Fiscal 4Q23 2023 | YTD Fiscal 2024 | YTD Fiscal 2023 | |||||||||||
| Ben Liquidity | $ | (29,443 | ) | $ | (606,405 | ) | $ | (18,861 | ) | $ | (1,810,964 | ) | $ | (46,512 | ) | |
| Ben Custody | (49,971 | ) | (267,995 | ) | 5,726 | (588,811 | ) | 24,046 | ||||||||
| Corporate & Other | (115,637 | ) | (20,217 | ) | (23,632 | ) | (210,169 | ) | (112,845 | ) | ||||||
| Less: Loss on debt extinguishment, net (intersegment elimination) | — | 3,940 | — | 3,940 | — | |||||||||||
| Less: Income tax expense (benefit) (allocable to Ben and BCH equity holders) | 46 | 75 | — | 121 | (1,072 | ) | ||||||||||
| Less: Net loss attributable to noncontrolling interests - Ben | 133,172 | 360,695 | 5,850 | 535,157 | 19,081 | |||||||||||
| Less: Noncontrolling interest guaranteed payment | (4,292 | ) | (4,229 | ) | (4,044 | ) | (16,793 | ) | (15,822 | ) | ||||||
| Net loss attributable to Ben's common shareholders | $ | (66,217 | ) | $ | (542,166 | ) | $ | (34,961 | ) | $ | (2,095,641 | ) | $ | (130,980 | ) | |
Earnings Webcast
Beneficient will host a webcast and conference call to review its fourth-quarter and fiscal year 2024 financial results today,
Replay
The webcast will be archived on the Company’s website in the investor relations section for replay for at least one year.
About Beneficent
Beneficient (Nasdaq: BENF) – Ben, for short – is on a mission to profoundly innovate the global alternative asset investment market by disrupting what we consider outdated, inefficient, cost prohibitive and time-consuming processes to access early liquidity and for capital formation and investment flows in our market. We provide traditionally underserved investors − mid-to-high net worth individuals, small-to-midsized institutions and
Its subsidiary,
For more information, visit www.trustben.com or follow us on LinkedIn.
Contacts
Investors:
investors@beneficient.com
Disclaimer and Cautionary Note Regarding Forward-Looking Statements
This press release contains forward-looking statements within the meaning of Section 27A of the Securities Act of 1933, as amended, and Section 21E of the Securities Exchange Act of 1934, as amended, with respect to, among other things, demand for our solutions in the alternative asset industry, opportunities for market growth, expansion of our Preferred Liquidity Provider Program and Primary Commitment Program, our ability to close transactions, the timeline for closing transactions, diversification of our loan portfolio and our ability to scale operations and provide shareholder value. These forward-looking statements are generally identified by the use of words such as “anticipate,” “believe,” “could,” “estimate,” “expect,” “intend,” “may,” “plan,” “potential,” “predict,” “project,” “should,” “target,” “will,” “would,” and, in each case, their negative or other various or comparable terminology. These forward-looking statements reflect our views with respect to future events as of the date of this document and are based on our management’s current expectations, estimates, forecasts, projections, assumptions, beliefs and information. Although management believes that the expectations reflected in these forward-looking statements are reasonable, it can give no assurance that these expectations will prove to have been correct. All such forward-looking statements are subject to risks and uncertainties, many of which are outside of our control, and could cause future events or results to be materially different from those stated or implied in this document. It is not possible to predict or identify all such risks. These risks include, but are not limited to, our ability to consummate GP Primary and other liquidity transactions on terms desirable for the Company, or at all, and the risk factors that are described under the section titled “Risk Factors” in our Annual Report on Form 10-K, Quarterly Reports on Form 10-Q, Current Reports on Form 8-K, and other filings with the
Table 6: CONSOLIDATED STATEMENTS OF COMPREHENSIVE INCOME (LOSS)
| Year Ended | |||||||
| (Dollars in thousands, except per share amounts) | 2024 | 2023 | |||||
| Revenues | |||||||
| Investment income (loss), net | $ | 4,791 | $ | (54,010 | ) | ||
| Loss on financial instruments, net (related party of | (104,521 | ) | (51,421 | ) | |||
| Interest and dividend income | 457 | 412 | |||||
| Trust services and administration revenues (related party of | 365 | 30 | |||||
| Other income | 212 | 86 | |||||
| Total revenues | (98,696 | ) | (104,903 | ) | |||
| Operating expenses | |||||||
| Employee compensation and benefits | 65,129 | 45,527 | |||||
| Interest expense (related party of | 17,559 | 15,471 | |||||
| Professional services | 29,999 | 38,422 | |||||
| Provision for credit losses | 6,016 | 20,580 | |||||
| Loss on impairment of goodwill | 2,354,320 | — | |||||
| Loss on arbitration | 54,973 | — | |||||
| Other expenses (related party of | 21,854 | 28,269 | |||||
| Total operating expenses | 2,549,850 | 148,269 | |||||
| Operating loss | (2,648,546 | ) | (253,172 | ) | |||
| Loss on extinguishment of debt, net | 8,846 | — | |||||
| Loss before income taxes | (2,657,392 | ) | (253,172 | ) | |||
| Income tax expense (benefit) | 788 | (1,072 | ) | ||||
| Net loss | (2,658,180 | ) | (252,100 | ) | |||
| Less: Net loss attributable to noncontrolling interests - Customer ExAlt Trusts | 44,175 | 117,861 | |||||
| Less: Net loss attributable to noncontrolling interests - Ben | 535,157 | 19,081 | |||||
| Less: Noncontrolling interest guaranteed payment | (16,793 | ) | (15,822 | ) | |||
| Net loss attributable to Beneficient common shareholders | $ | (2,095,641 | ) | $ | (130,980 | ) | |
| Other comprehensive income: | |||||||
| Unrealized gain on investments in available-for-sale debt securities | 4,070 | 11,226 | |||||
| Total comprehensive loss | (2,091,571 | ) | (119,754 | ) | |||
| Less: comprehensive gain attributable to noncontrolling interests | 4,070 | 11,226 | |||||
| Total comprehensive loss attributable to Beneficient | $ | (2,095,641 | ) | $ | (130,980 | ) | |
| Net loss per common share - basic and diluted (1) (2) | |||||||
| Class A | $ | (673.31 | ) | $ | (52.57 | ) | |
| Class B | $ | (584.23 | ) | $ | (52.57 | ) | |
| Weighted average common shares outstanding - basic and diluted (1) (2) | |||||||
| Class A | 2,904,851 | 2,252,228 | |||||
| Class B | 239,256 | 239,256 | |||||
(1) Retroactively adjusted the fiscal year ended
(2) Periods presented have been adjusted to reflect the 1-for-80 reverse stock split on
Table 7: CONSOLIDATED STATEMENTS OF FINANCIAL CONDITION
| As of | |||||||
| (Dollars and shares in thousands) | |||||||
| ASSETS | |||||||
| Cash and cash equivalents | $ | 7,913 | $ | 8,726 | |||
| Restricted cash | 64 | 819 | |||||
| Investments, at fair value: | |||||||
| Investments held by Customer ExAlt Trusts (related party of | 329,113 | 491,859 | |||||
| Investments held by Ben (related party of | 6 | 5,362 | |||||
| Other assets, net (related party of nil and | 14,699 | 32,903 | |||||
| Intangible assets | 3,100 | 3,100 | |||||
| 13,606 | 2,367,926 | ||||||
| Total assets | $ | 368,501 | $ | 2,910,695 | |||
| LIABILITIES, TEMPORARY EQUITY, AND EQUITY | |||||||
| Accounts payable and accrued expenses (related party of | $ | 157,157 | $ | 65,724 | |||
| Other liabilities (related party of | 31,727 | 14,622 | |||||
| Warrant liability | 178 | — | |||||
| Customer ExAlt Trusts loan payable, net | — | 52,129 | |||||
| Debt due to related parties | 120,505 | 99,314 | |||||
| Total liabilities | 309,567 | 231,789 | |||||
| Redeemable noncontrolling interests | |||||||
| Preferred Series A Subclass 0 Unit Accounts, nonunitized | 251,052 | 251,052 | |||||
| Preferred Series A Subclass 1 Unit Accounts, nonunitized | — | 699,441 | |||||
| Total temporary equity | 251,052 | 950,493 | |||||
| Shareholder’s equity (1) | |||||||
| Preferred stock, par value | |||||||
| Series A preferred stock, 0 and 0 shares issued and outstanding as of | — | — | |||||
| Series B preferred stock, 227 and 0 shares issued and outstanding as of | — | — | |||||
| Class A common stock, par value | 3 | 2 | |||||
| Class B convertible common stock, par value | — | — | |||||
| Additional paid-in capital (2) | 1,848,068 | 1,579,742 | |||||
| Accumulated deficit | (2,059,214 | ) | — | ||||
| Stock receivable | (20,038 | ) | — | ||||
| (3,444 | ) | (3,444 | ) | ||||
| Noncontrolling interests | 42,231 | 142,213 | |||||
| Accumulated other comprehensive income (loss) | 276 | 9,900 | |||||
| Total equity (deficit) | (192,118 | ) | 1,728,413 | ||||
| Total liabilities, temporary equity, and equity | $ | 368,501 | $ | 2,910,695 | |||
(1) Retroactively adjusted
(2) Periods presented have been adjusted to reflect the 1-for-80 reverse stock split on
Table 8: Non-GAAP Reconciliations
| (in thousands) | Three Months Ended | |||||||||||||||||
| Ben Liquidity | Ben Custody | Customer ExAlt Trusts | Corporate/ Other | Consolidating Eliminations | Consolidated | |||||||||||||
| Total revenues | $ | 10,644 | $ | 5,573 | $ | (43,205 | ) | $ | 56 | $ | (16,025 | ) | $ | (42,957 | ) | |||
| Mark to market adjustment on interests in | — | — | 3,207 | 33 | — | 3,240 | ||||||||||||
| Adjusted revenues | $ | 10,644 | $ | 5,573 | $ | (39,998 | ) | $ | 89 | $ | (16,025 | ) | $ | (39,717 | ) | |||
| Operating income (loss) | $ | (29,443 | ) | $ | (49,971 | ) | $ | (82,014 | ) | $ | (115,637 | ) | $ | 82,204 | $ | (194,861 | ) | |
| Mark to market adjustment on equity security of related party | — | — | 3,207 | 33 | — | 3,240 | ||||||||||||
| Intersegment provision for credit losses on collateral comprised of related party equity securities | 35 | 25,252 | — | — | (25,287 | ) | — | |||||||||||
| Provision for credit losses related to receivables from related party and formative transaction note receivables | — | — | — | 5,515 | — | 5,515 | ||||||||||||
| — | 28,716 | — | 39,392 | — | 68,108 | |||||||||||||
| Loss on arbitration | — | — | — | 54,973 | — | 54,973 | ||||||||||||
| Share-based compensation expense | — | — | — | 1,573 | — | 1,573 | ||||||||||||
| Legal and professional fees (1) | — | — | — | 3,018 | — | 3,018 | ||||||||||||
| Adjusted operating income (loss) | $ | (29,408 | ) | $ | 3,997 | $ | (78,807 | ) | $ | (11,133 | ) | $ | 56,917 | $ | (58,434 | ) | ||
(1) Includes legal and professional fees related to
| (in thousands) | Three Months Ended | ||||||||||||||||||
| Ben Liquidity | Ben Custody | Customer ExAlt Trusts | Corporate/ Other | Consolidating Eliminations | Consolidated | ||||||||||||||
| Total revenues | $ | 11,275 | $ | 5,897 | $ | (11,182 | ) | $ | 789 | $ | (17,014 | ) | $ | (10,235 | ) | ||||
| Mark to market adjustment on interests in the | — | — | 18,506 | 185 | — | 18,691 | |||||||||||||
| Adjusted revenues | $ | 11,275 | $ | 5,897 | $ | 7,324 | $ | 974 | $ | (17,014 | ) | $ | 8,456 | ||||||
| Operating income (loss) | $ | (606,405 | ) | $ | (267,995 | ) | $ | (49,363 | ) | $ | (20,217 | ) | $ | 28,029 | $ | (915,951 | ) | ||
| Mark to market adjustment on interests in the | — | — | 18,506 | 185 | — | 18,691 | |||||||||||||
| Intersegment provision for credit losses on collateral comprised of interests in the | 4,262 | — | — | — | (4,262 | ) | — | ||||||||||||
| Provision for credit losses related to receivables from related party and formative transaction note receivables | — | — | — | — | — | — | |||||||||||||
| 604,668 | 272,830 | — | 5,725 | — | 883,223 | ||||||||||||||
| Loss on arbitration | — | — | — | — | — | — | |||||||||||||
| Share-based compensation expense | — | — | — | 2,026 | — | 2,026 | |||||||||||||
| Legal and professional fees(1) | — | — | — | 327 | — | 327 | |||||||||||||
| Adjusted operating income (loss) | $ | 2,525 | $ | 4,835 | $ | (30,857 | ) | $ | (11,954 | ) | $ | 23,767 | $ | (11,684 | ) | ||||
(1) Includes legal and professional fees related to
| (in thousands) | Three Months Ended | ||||||||||||||||
| Ben Liquidity | Ben Custody | Customer ExAlt Trusts | Corporate/ Other | Consolidating Eliminations | Consolidated | ||||||||||||
| Total revenues | $ | 12,899 | $ | 6,762 | $ | (16,096 | ) | $ | (2,379 | ) | $ | (19,654 | ) | $ | (18,468 | ) | |
| Mark to market adjustment on equity security of related party | — | — | 393 | 99 | — | 492 | |||||||||||
| Adjusted Revenues | $ | 12,899 | $ | 6,762 | $ | (15,703 | ) | $ | (2,280 | ) | $ | (19,654 | ) | $ | (17,976 | ) | |
| Operating income (loss) | $ | (18,861 | ) | $ | 5,726 | $ | (54,064 | ) | $ | (23,632 | ) | $ | 41,816 | $ | (49,015 | ) | |
| Mark to market adjustment on equity security of related party | — | — | 393 | 99 | — | 492 | |||||||||||
| Intersegment provision for credit losses on collateral comprised of related party equity securities | 18,371 | — | — | — | (18,371 | ) | — | ||||||||||
| Provision for credit losses related to receivables from related party and formative transaction note receivables | — | — | — | — | — | — | |||||||||||
| — | — | — | — | — | — | ||||||||||||
| Loss on arbitration | — | — | — | — | — | — | |||||||||||
| Share-based compensation expense | — | — | — | 1,923 | — | 1,923 | |||||||||||
| Legal and professional fees(1) | — | — | — | 3,726 | — | 3,726 | |||||||||||
| Adjusted operating income (loss) | $ | (490 | ) | $ | 5,726 | $ | (53,671 | ) | $ | (17,884 | ) | $ | 23,445 | $ | (42,874 | ) | |
(1) Includes legal and professional fees related to
| Operating Expenses Non GAAP Reconciliation | Three Months Ended | Three Months Ended | ||||
| Operating expenses | $ | 151,904 | $ | 30,547 | ||
| Less: Loss on arbitration | (54,973 | ) | — | |||
| Less: | (68,108 | ) | — | |||
| Operating expenses, excluding goodwill impairment and recognized loss contingency | $ | 28,823 | $ | 30,547 | ||
| (in thousands) | Year Ended | ||||||||||||||||||
| Ben Liquidity | Ben Custody | Customer ExAlt Trusts | Corporate/ Other | Consolidating Eliminations | Consolidated | ||||||||||||||
| Total revenues | $ | 46,947 | $ | 24,534 | $ | (97,568 | ) | $ | (1,493 | ) | $ | (71,116 | ) | $ | (98,696 | ) | |||
| Mark to market adjustment interests in the | — | — | 66,080 | 1,377 | — | 67,457 | |||||||||||||
| Adjusted revenues | $ | 46,947 | $ | 24,534 | $ | (31,488 | ) | $ | (116 | ) | $ | (71,116 | ) | $ | (31,239 | ) | |||
| Operating income (loss) | $ | (1,810,964 | ) | $ | (588,811 | ) | $ | (248,065 | ) | $ | (210,169 | ) | $ | 209,463 | $ | (2,648,546 | ) | ||
| Mark to market adjustment interests in the | — | — | 66,080 | 1,377 | — | 67,457 | |||||||||||||
| Intersegment provision for credit losses on collateral comprised of interests in the | 43,907 | 25,252 | — | — | (69,159 | ) | — | ||||||||||||
| Provision for credit losses related to formerly held available-for-sale debt securities of related party | — | — | — | — | — | — | |||||||||||||
| Provision for credit losses related to receivables from related party and formative transaction note receivables | — | — | — | 5,515 | — | 5,515 | |||||||||||||
| 1,725,880 | 583,323 | — | 45,117 | — | 2,354,320 | ||||||||||||||
| Loss on arbitration | — | — | — | 54,973 | — | 54,973 | |||||||||||||
| Share-based compensation expense | — | — | — | 39,103 | — | 39,103 | |||||||||||||
| Legal and professional fees(1) | — | — | — | 11,370 | — | 11,370 | |||||||||||||
| Defunct product offering costs | — | — | — | — | — | — | |||||||||||||
| Adjusted operating income (loss) | $ | (41,177 | ) | $ | 19,764 | $ | (181,985 | ) | $ | (52,714 | ) | $ | 140,304 | $ | (115,808 | ) | |||
(1) Includes legal and professional fees related to
| (in thousands) | Year Ended | |||||||||||||||||
| Ben Liquidity | Ben Custody | Customer ExAlt Trusts | Corporate/ Other | Consolidating Eliminations | Consolidated | |||||||||||||
| Total revenues | $ | 50,819 | $ | 29,042 | $ | (89,041 | ) | $ | (15,892 | ) | $ | (79,831 | ) | $ | (104,903 | ) | ||
| Mark to market adjustment on equity security of related party | — | — | 50,661 | 12,875 | — | 63,536 | ||||||||||||
| Adjusted revenues | $ | 50,819 | $ | 29,042 | $ | (38,380 | ) | $ | (3,017 | ) | $ | (79,831 | ) | $ | (41,367 | ) | ||
| Operating income (loss) | $ | (46,512 | ) | $ | 24,046 | $ | (248,038 | ) | $ | (112,845 | ) | $ | 130,177 | $ | (253,172 | ) | ||
| Mark to market adjustment on equity security of related party | — | — | 50,661 | 12,875 | — | 63,536 | ||||||||||||
| Intersegment provision for loan losses on collateral comprised of related party equity securities | 56,205 | — | — | — | (56,205 | ) | — | |||||||||||
| Provision for credit losses related to available-for-sale debt securities of related party | — | — | 12,607 | 14 | — | 12,621 | ||||||||||||
| Provision for credit losses related to receivables from related party and formative transaction note receivables | — | — | — | 6,723 | — | 6,723 | ||||||||||||
| — | — | — | — | — | — | |||||||||||||
| Loss on arbitration | — | — | — | — | — | — | ||||||||||||
| Share-based compensation expense | — | — | — | 10,085 | — | 10,085 | ||||||||||||
| Legal and professional fees(1) | — | — | — | 12,521 | — | 12,521 | ||||||||||||
| Defunct product offering costs | — | — | — | 3,814 | — | 3,814 | ||||||||||||
| Adjusted operating income (loss) | $ | 9,693 | $ | 24,046 | $ | (184,770 | ) | $ | (66,813 | ) | $ | 73,972 | $ | (143,872 | ) | |||
(1) Includes legal and professional fees related to
Adjusted Revenues, Adjusted Operating Income (Loss), Adjusted Segment Revenues attributable to Ben's Equity Holders and Adjusted Segment Operating Income (Loss) attributable to Ben's Equity Holders are non-GAAP financial measures. We present these non-GAAP financial measures because we believe it helps investors understand underlying trends in our business and facilitates an understanding of our operating performance from period to period because it facilitates a comparison of our recurring core business operating results. These non-GAAP financial measures are intended as a supplemental measure of our performance that is neither required by, nor presented in accordance with,
We define adjusted revenue as revenue adjusted to exclude the effect of mark-to-market adjustments on related party equity securities that were acquired both prior to and during the Collateral Swap, which on
Adjusted operating income (loss) represents GAAP operating income (loss), adjusted to exclude the effect of the adjustments to revenue as described above, credit losses on related party available-for-sale debt securities that were acquired in the Collateral Swap which on
These non-GAAP financial measures are not a measure of performance or liquidity calculated in accordance with
Because of these limitations, Adjusted Revenues, Adjusted Operating Income (Loss), Adjusted Segment Revenues attributable to Ben's Equity Holders and Adjusted Segment Operating Income (Loss) attributable to Ben's Equity Holders should not be considered in isolation or as a substitute for performance measures calculated in accordance with
A photo accompanying this announcement is available at https://www.globenewswire.com/NewsRoom/AttachmentNg/9b548b0c-1660-4fee-b2fd-9cfe02d29cd8

![]()
The charts below present the ExAlt Loan portfolio’s relative exposure

Beneficient Pie Charts
2024 GlobeNewswire, Inc., source
