Talking Points:
- ‘Risk-trade’ showing signs of a pullback nearing
- Clear technical patterns provide in Nas100, US30, JPN225 provide guidance
- Equities, rates and FX all moving in sync
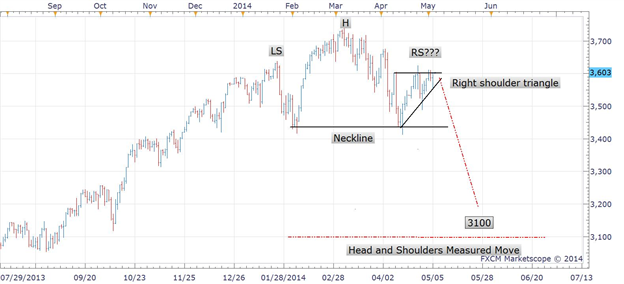
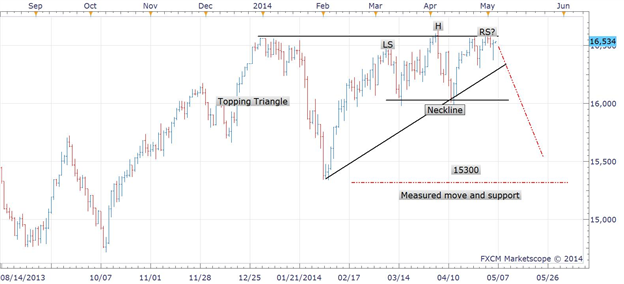
Are equities and risk about to enter pullback mode? Recent price action suggest that the market is moving towards making a break lower. The Nasdaq and Dow 30, in particular, are carving out Head-and-Shoulder patterns. The Nasdaq is doing so with the possibility of a right shoulder triangle, and the Dow is doing the same with a broad ‘Triangle Top’. The S&P500 is still postured the strongest, less than 1% from new highs, and small cap stocks (Russell 2000) acting the weakest, off highs by 7%. The fact that small cap names have failed to catch the same kind of bid as large cap stocks further suggest appetite for risk is waning. When investors and money managers are feeling confident about the economy and higher stock prices, they will snatch up the riskiest shares, or those companies with the greatest growth potential – small cap stocks. That is not the case right now.
NAS100 (Nasdaq 100) – Daily Head-and-shoulders w/right shoulder triangle
US30 (DOW) – Daily Head-and-shoulders, Triangle Top formation
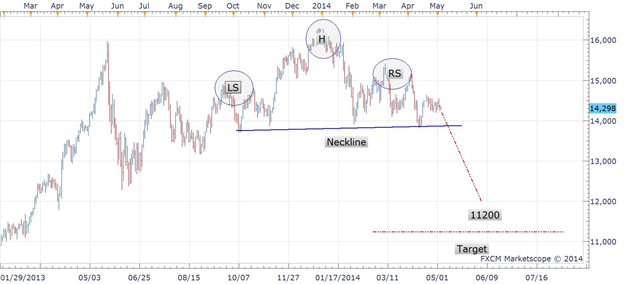
The Nikkei is another Index of interest given its relative weakness and correlation to USD/JPY. This index has been teetering for some time now, creating a head-and-shoulders pattern. It looks as though this index will take a hit at the first sign of weakness in global stock markets. The 10-year rate, which also trades in line with USDJPY, is flirting with support. The set-up for selling risk, buying bonds is brewing.
JPN225 (Nikkei) – Daily Head-and-shoulders, leaning over
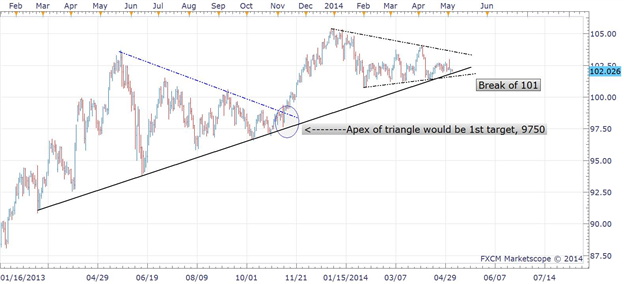
USDJPY – Daily Break of Trend-lines
Charts created by Paul Robinson using MarketScope 2.0.
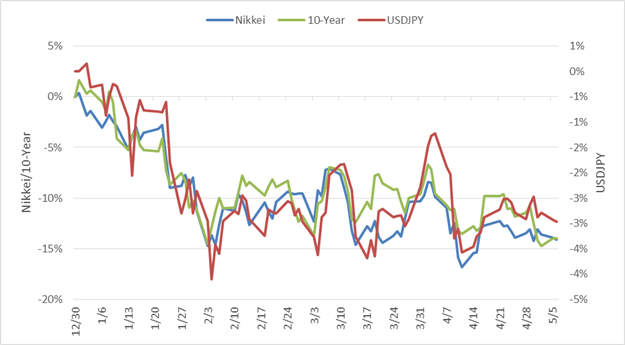
Year-to-Date Overlay of Nikkei/10-Year Yield/USDJPY (All-the-same-market – Correlation is high.)
The most compelling aspect of this broad market scenario is that each market’s technical set-ups are in alignment for triggering in near simultaneous fashion. Price breaks as follows – SPX500 < 1860, US30 < 16250, Nas100 < 3550, JPN225< 13750, US 10-yr < 2.50% and USDJPY < 101. If a near simultaneous break across the board takes place, look for each market to propel one another lower in a reflexive manner over the near-term.
How far of a drop could be in store? There has been little reason in recent years to suggest any declines in risk to be anything more than corrections, however; there is enough downside room before reaching significant support levels to at least give us a good trade and some tradable volatility.
--Written by Paul Robinson of FXSimplified.com
original source


