Talking Points:
- Steep Weekly Uptrend in GBP/AUD
- Tradable Pullbacks on Shorter Time Frames
- How to Day or Swing Trade This Set-up
Ever since GBPAUD began its current continuation of a huge uptrend that coincided with a buying opportunity we covered here months ago, the pair has been a source of many trade opportunities. In spite of the trend becoming somewhat long in the tooth, the conditions for yet another potential buying opportunity are beginning to ripen once again.
See previous article: GBP/AUD Swing Trade That Could Play Out 4 Ways
The weekly chart below provides an excellent view of the trend, which is developing within a well-defined rising parallel channel. The only cautionary aspect is that price has very recently tested the upper channel boundary, and this may be an intermediate-term turning point.
Guest Commentary: Massive Uptrend in GBP/AUD

Nonetheless, the best response is always to assume that the continuation of the uptrend will occur until the contrary occurs. Otherwise, some of the best trades will be missed.
One logical approach for hopping onto a continuation trade is to keep looking for a large enough pullback so that risk can be carefully controlled, and in order to find such pullbacks, traders often resort to multiple time frames.
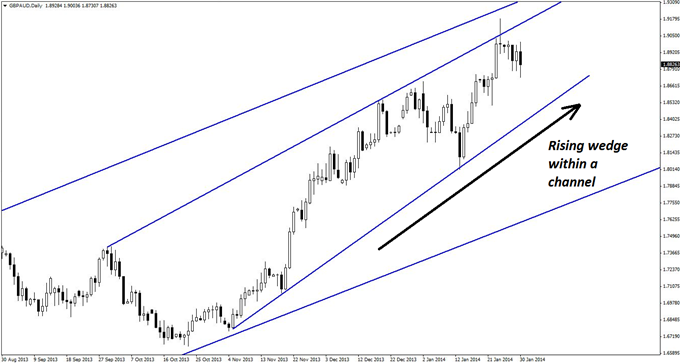
In this case, the daily chart of GBPAUD is exhibiting a rising wedge pattern within the larger parallel channel, but there is now some evidence of a pullback.
Guest Commentary: Rising Wedge on GBP/AUD Daily Chart
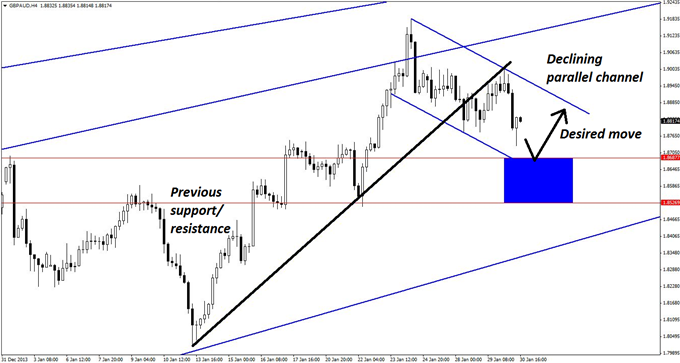
In order to better define a zone of support for taking this trade, however, we move to the four-hour chart, which is surprisingly rich and forthcoming with information. As shown below, there is a declining parallel channel whose support is about to be tested. This coincides with several horizontal support and resistance levels. Even more compelling, there are targets based on classical technical analysis that also coincide around the same area. On the whole, the support zone has been estimated as 1.8526-1.8687.
Guest Commentary: Key Support Zone for Buying GBP/AUD
This zone is notable for being 161 pips deep, which may be a little large for most traders. However, using precise trade triggers can enable this trade to be taken on reduced risk.
On the hourly chart (not shown), the trigger can be a bullish reversal divergence, a pin bar, or a bullish engulfing candlestick pattern. Two or three tries may be required to get on the trend, but this trade has at least 480 pips to move before testing the previous high, and even more if the trend continues. Each try will probably have a net average risk of about 60 pips.
In this particular instance, it may also be possible to take the trade on the four-hour chart using the same triggers mentioned above. Although that will require larger risk in terms of pips, proper position sizing and risk control should be applied to keep the total risk of the trade below 2% of the trader's account.
Each trigger time frame will have its own advantages and disadvantages. The hourly chart will afford better precision and risk profile, but it may take more tries to get in. The four-hour chart provides greater precision, but potentially less upside due to the larger pip risk required from waiting for the relevant triggers.
Since more traders are interested in intraday trades, the primary focus for the trade is still the hourly time frame, but swing traders may like the idea of taking it on the four-hour time frame instead.
By Kaye Lee, private fund trader and head trader consultant, StraightTalkTrading.com
original source

