To receive Tyler’s analysis directly via email, please SIGN UP HERE
Talking Points:
- Crude Oil Technical Strategy: Buying Dips Above 200-DMA, Targeting $51.06/bbl
- US DOLLAR weakness continues to provide support for commodities & Commodity FX
- Sentimental Trading System Warns of Further Weakness
Even though the price of Oil has rallied by 61.5% from the February low, and on Tuesday hit a 4-month high there are few signs of why the rally would stop. Of course, it’s fair to say that we likely won’t have another ~60%+ gain over the next 45-days, but it would make sense to keep looking higher until proven wrong, here’s why.
First, the markets that support higher Oil demand are doing well. Emerging Markets were a key buyer of Oil in the wake of the financial crisis and made up as much as 44% of global oil demand before slowing down in 2013 and 2014. Now, equity markets like those in Brazil are up 35%+ for the year after bottoming out in January.
Another component that could lead to further Crude Oil appreciation is the recent weakness of the US Dollar. Janet Yellen of the Federal Reserve have recently mentioned the US Dollar as a headwind to global growth and therefore, the Fed may ensure that rhetoric appears less US Dollar supportive, which would further push the cause of commodity strength like Gold & Oil in addition to US Dollar counterparts.
Additionally, there looks to be a developing irony in the Oil market regarding the Oil market & Oil companies that could continue to muddy the waters going forward. We’ve recently heard from Wells Fargo that they doubled their energy loan exposure when Oil was at $102/barrel in early 2014. While it’s not good to be a bank lending when Oil was at ~$100+/barrel, it’s worse to be borrowing and borrowing at max capacity before your key asset that you produce is about to see a ~70+ drop in market value.
Learn more about the breakdown of oil production – click here.
Now, the rest of 2016 could be a combination of an obvious rise in Oil companies defaulting on their debt at the same time the Oil market finds its way out of a bear market. Unfortunately for many E&P companies, given the debt burden they hold, it is near impossible for many firms to borrow their way out of this mess as banks have been cutting open credit lines. Therefore, it’s entirely possible and likely that we’ll see increased bankruptcies in the industry that may lead to confusion over the state of the oil market going forward. However, the inability for Oil companies to service existing debts doesn’t mean the price of Oil can’t continue to trend higher and due to influencing factors; it may do just that.
Confluence of Support Aligning Under Current Price
To See How FXCM’s Live Clients Are Positioned In FX & Equities Click Here Now.
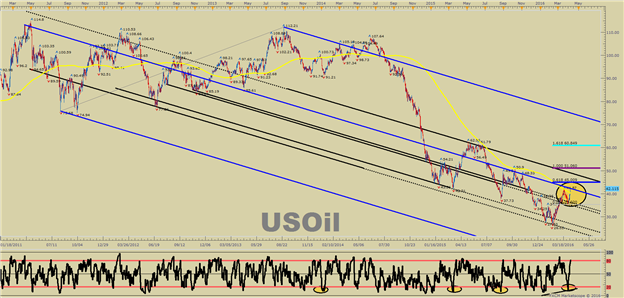
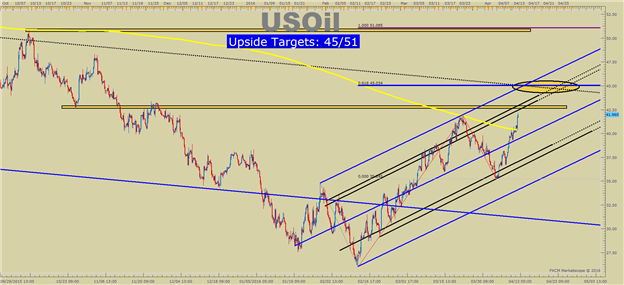
The above chart is a long-term price channel via Andrew’s Pitchfork tool with sliding parallels drawn with the slope of the median line off of key pivots. You’ll notice on the bottom-right of the chart; the key pivots acted as support in Q2 2015 & Q1 2016. However, we have now seen a break above the 200-DMA which turns focus higher into the next two Fibonacci extensions of $45/51 per bbl.
In the last technical note, we argued that Bull should be encouraged by the potential of price to move above the Daily Ichimoku Kijun-Sen line that currently sits at $37.70/barrel. For now, it’s too early to tell, but give the macro environment I think we’re in (risk-on / USD weakness), I would favor a bullish continuation toward the levels higher displayed on the charts. While the 161.8% Fibonacci Expansion target isn’t expected to hit this year (light blue line on top chart), it currently sits at $60.85. That target hitting would equate to a 133% rally off the low, and would likely only be seen with a significance US Dollar fallout in 2016.
Key Support Levels from Here (Visual Map Below)
Contrarian System Warns of a Test of Key Support Lower
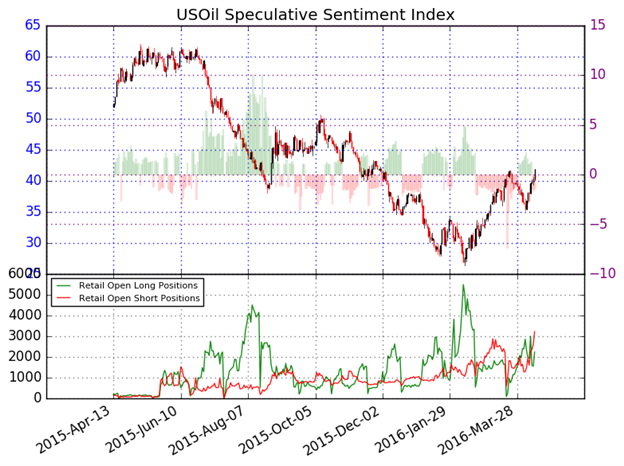
In addition to the technical focus around Andrew’s Pitchfork, the sliding parallels, and the Intermarket relationship of US Dollar weakness, we should keep an eye on retail sentiment, which could be warning us of more upside price action, which would align with our Speculative Sentiment Index or SSI.
According to client positions at FXCM, the ratio of long to short positions in the US Oil stands at -1.44 as 41% of traders are long. Short positions are 28.8% higher than yesterday and 123.6% above levels seen last week. Open interest is 23.2% higher than yesterday and 44.7% above its monthly average. We use our SSI as a contrarian indicator to price action, and the fact that the majority of traders are short gives a signal that the WTI Crude Oil may continue higher. The trading crowd has grown further net-short from yesterday but unchanged since last week. The combination of current sentiment and recent changes gives a further bullish trading bias.
In the last note, we stated:
If the [SSI] were to turn negative again, and the price breaks above the 200-DMA resistance, we might well be on our way back to $50/bbl.
While there will likely be a lot of volatility in the days ahead, WTI Crude Oil’s Momentum Breakout could be a defining move of Oil’s next trend.
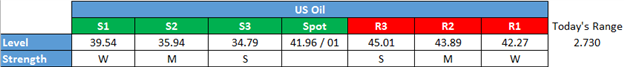
Key Levels Over the Next 48-hrs As of Wednesday, April 12, 2016
T.Y.
Think a bottom is in or forming in Oil? Trade Oil With Low Margin Requirements (non-US Residents only)
original source


