Talking Points:
- Chinese stocks saw another brutal session, with the Shanghai Composite falling by -6.42% and the Shenzhen Composite falling by -7.12%.
- Many other bourses are clinging to support ahead of heavy data: Apple reports earnings after the bell today, the Fed finishes their two-day meeting tomorrow, and the Bank of Japan issues a monetary policy statement towards the end of this week.
- Potential for volatility for the remainder of this week is extremely elevated. Make sure your risk management has been addressed, and if you’re looking for ways to generate trade ideas based on crowd positioning and sentiment, check out our Real-Time SSI. It’s free.
It’s been another rough night for Chinese equities as stocks from the Mainland dropped to a new 13-month low. The Shanghai Composite got hit by -6.42% while the Shenzhen Composite was off by -7.12%. Perhaps more troubling is the fact that the Shanghai Composite appears to have left behind a pivotal support value at the psychological level of 3,000. This is a huge level for the bourse and over the previous couple of weeks, price action clung to this level for quite a while, when even dips would return to support (becoming new resistance).
Last night’s session was relatively flat ahead of the mid-day break, but after traders came back for the second half, the selling was constant and prices just got pulverized.
There’s a lot of confusion around Chinese stocks right now, and making matters more difficult is accessibility of information. Getting market intelligence out of China isn’t anywhere near as simple or thorough as what’s available for more developed economies. But to put these recent moves in scope, I’ve created the below chart in excel using closing values for the SSE Composite Index.
On the chart below, we’re looking at the anatomy of a bubble. Few realize what happened in Chinese stocks before the selling really took hold. In the blue box, you can see a bubble building as the Shanghai Composite shot from 2,000 to 5,131 in less than a year. There were no obvious catalysts here… Stocks just, went up. And as stocks went up, more people got interested and involved, and before you know it you have a full-blown cultural phenomenon. Farmers were throwing down their pitchforks in favor of laptops so that they could day trade Chinese stocks, and in many cases they were levered-up as much as possible.
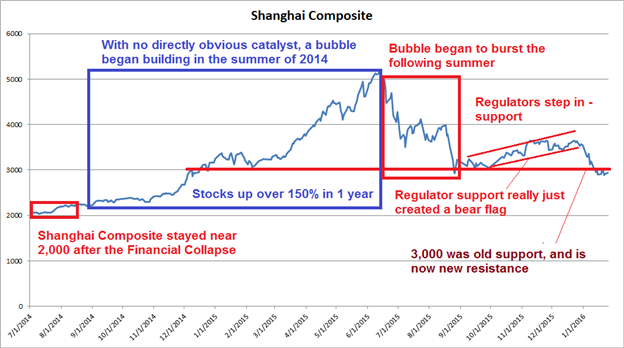
Shanghai Composite 7/1/2014-Current; data derived from Yahoo Finance; prepared by James Stanley
As you can see on the above chart, we’ve just hit the point where we’ve erased nearly all the gains of the ‘bubble.’ The long-term running value of 2,000 on the Shanghai Composite would be an obvious level to target for shorts, but when panics become involved in such matters, price action will often overshoot. Just like the S&P went all the way down to 666 during the panic of the Financial Collapse.
But perhaps more troubling is the technical indication of what’s happening (or just happened). We warned of the bear-flag building in Chinese stocks well before it broke, and I even titled the article: “Chinese Stocks Are in A Massive Bear Flag, and This is How We Got Here.’ A bear flag formation is, unfortunately, not a reversal pattern. It’s a continuation pattern. And this setup back in November and December was telling markets that the selling wasn’t over yet. It was the turn of the New Year that brought that to light.
But the technical indication of relevance right now is that 3,000 level on the Shanghai Composite. This old level of support is now a new level of resistance, and it appears as though we’re sitting in front of a continuation move in the trend.
On the Bright Side:
The only real silver lining here is that most other global bourses didn’t see that same type of pain that reverberated throughout China. I’ve even seen some morning reports saying ‘contagion fears are dead because the DAX (or insert any other favorite stock index) isn’t going down today.’ Be really careful with that type of stuff. One day is simply an observation; it takes weeks or even months for a theme to develop. And right now that theme is risk aversion in stock markets around the world and there are a plethora of reasons for that. We discussed these risks to the global economy to end last year in part 1, part 2 and part 3.
The fact that the DAX, and the Nikkei and even the S&P 500 continues to trade so near support shows that this isn’t a market in which buyers can’t wait to get their bids filled. If it were, prices would have already went up (and this is the reason price action is so utterly important for both traders and market watchers – it separates fiction from reality). It also shows that markets (excluding China) aren’t ready to make big movements lower just yet because if they were – we would already see increased selling and this, in and of itself, would move prices lower. But neither of these are happening at the moment; it’s almost as if the market is waiting on something…
The remainder of this week has quite a bit of heavy data. This week alone has 50% of the companies in the S&P 500 reporting earnings, and if there is a direct driver of stock prices, earnings are probably it. We can see major volatility in the S&P 500 depending on how these numbers come out. The big one that markets are waiting for is Apple, which can give investors a clue as to how well Chinese growth is holding up and, perhaps even further, to get a prospect of that boogeyman term we mentioned above: ‘contagion.’ We discussed this prospect in the article Apple, Oil to Cue Global Markets. This was from last October, and we were warning of the direct correlation that had built between US Stocks and US Oil. Apple has also been displaying a leading indication of Chinese growth, with some tapering in demand being seen over the last year.
On the chart below, we’re looking at a correlation between Apple (AAPL) and the S&P 500. Notice how each of the two major sell-offs of the last six months, were preceded by a major drop in Apple first. In mid-July, Apple topped-out and began selling off as we moved in to August. Later in August, the S&P got hit by worries over China. Again, in December, Apple began selling off viciously in the early portion of the month, only to be followed by the S&P later in the month.
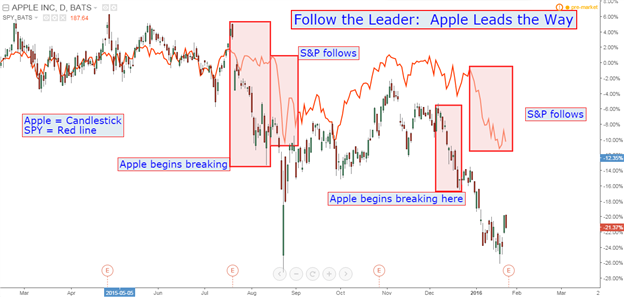
Created with Tradingview; prepared by James Stanley
If you’ve never traded earnings, let me warn you: There’s a lot of noise in these reports, and the pertinence of each is usually very subjective in nature. Top-line numbers are good and all, but what analysts are looking for here is a specific indication of how aggressively Chinese demand might be waning. So the real numbers of importance here are a) iPhone sales/shipments to Mainland China (their primary growth market at this point in the product cycle) and b) revisions to earnings estimates for upcoming quarters.
This second data point is probably the most important, as both Apple and Tim Cook have continued to allude to continued strength in China. At this point, Apple hasn’t made any suggestions that they’re seeing a slowdown in their business growth in China, even if their numbers did raise some questions on that front over the previous two quarters. Given the company’s cozy relationship with Chinese authorities, it makes sense to not expect them to come out and say ‘it’s all going down!’ So, the devil is in the details here, and if they do actually want to communicate the expectation for weakness in China, it will likely be done in a word-smithy and diplomatic type-of-way.
This could be a big one. Report comes out after the bell.
Tomorrow brings us the Fed. There were never really any expectations for a hike at this meeting considering that we just had one a little over a month ago, but interesting here will be the statement or any comments that the Fed might make towards Oil prices or ‘International risks.’ If the Fed takes a really dovish stance, alluding to the fact that rate hikes might be on hold while Oil prices are so low or something along those lines, this could be risk positive as we watch stock markets tear higher. The Fed appears to be the big push point here as risk aversion really heated up right after that first rate hike. But as we’ve been saying, the fact that it took ~2 weeks for the selling to really develop after that rate hike highlights the fact that it’s probably not the 25 basis point hike itself that’s causing the pain, but more likely the four full rate hikes that the Fed is expecting for this year. Even if the next hike or the one after that goes off successfully, investors are still looking at another 50 basis points of hikes in the remainder of the year, and that is a markedly different operating environment after six years of ZIRP.
So this gives the Fed some room to work with. By setting expectations artificially ‘more aggressive,’ the simple act of them getting more conservative (more dovish, less hawkish – they aren’t as aggressive towards rate hikes), then that may be a type of support in-and-of-itself. The only problem at this point is that it hasn’t worked: We saw James Bullard try something similar two weeks ago, but the selling only hastened further.
As we move into tomorrow’s Fed meeting, US Stocks are clinging to support by a thread. We just set a new low last week, and the relief rally that ensued after Mario Draghi’s QE-hints just gave markets a lower-high to work with. The S&P is still seeing continued resistance at 1,905, which is the 23.6% retracement of the previous major move (2,137 top to the 1833.50 low). The fact that price action is still working within this Fibonacci retracement indicates that extensions below price action may come in as future targets should new lows be made.
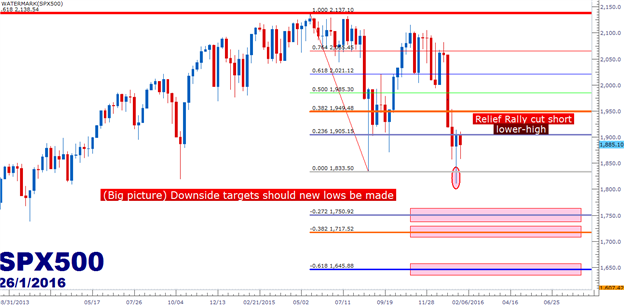
Created with Marketscope/Trading Station II; prepared by James Stanley
--- Written by James Stanley, Analyst for DailyFX.com
To receive James Stanley’s analysis directly via email, please SIGN UP HERE
Contact and follow James on Twitter: @JStanleyFX
original source


