This publication attempts to further explore the concept that mass movements of human psychology, as represented by the financial markets, are subject to the mathematical laws of nature and through the use of various geometric, arithmetic, statistical and cyclical techniques a better understanding of markets and their corresponding movements can be achieved.
Foreign Exchange Price & Time at a Glance:
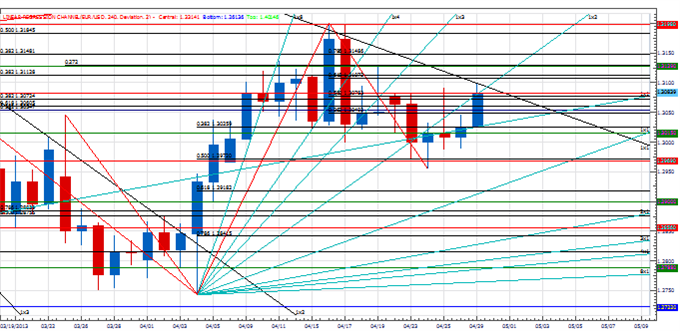
EUR/USD:
Charts Created using Marketscope – Prepared by Kristian Kerr
-EUR/USD has rebounded further since finding support last week at the 50% retracement of the month-to-date range in the 1.2970
-While below the 1.3200 4th square root progression of the year-to-date low our broader bias has to remain lower in the euro
-The 38% retracement of this month’s range in the 1.3025 area is near-term support but 1.2970 remains a critical near-term pivot with weakness below needed to signal the resumption of the broader decline
-A cyclical turn window related to the all-time extremes in the single currency remains in effect
-The 1x1 Gann angle line drawn from the year-to-date high in 1.3085 area is important resistance, but only traction over 1.3200 on a closing basis turns us position on the exchange rate
Strategy: We were expecting some final strength into this turn window. It should be a fade if we are correct about a broader top forming here.
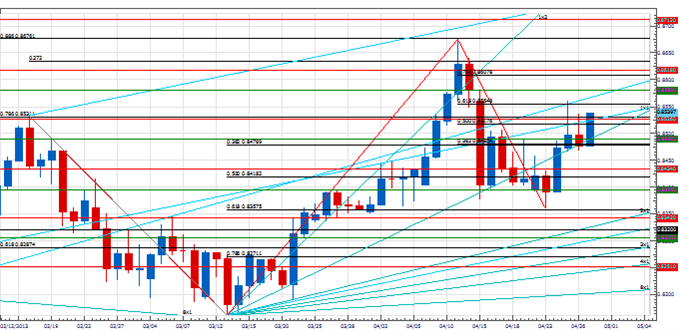
NZD/USD:
Charts Created using Marketscope – Prepared by Kristian Kerr
-NZD/USD reversed last week from the 61.8% retracement of the March to April advance in the .8355 area
-Subsequent strength through the 50% retracement of the late April decline in the .8525 area has us leaning higher, but a close over this level is really need to confirm the integrity of this latest move higher
-Near-term cycle analysis suggests scope for a minor turn over the next couple of days
-Weakness below the 38% retracement (resistance turned support) of the late April advance in the .8480 area would undermine burgeoning positive technical structure
-However, only weakness under .8355 indicates that a broader top is in place
Strategy: Wary of chasing Kiwi strength here given the cyclicality across other markets.
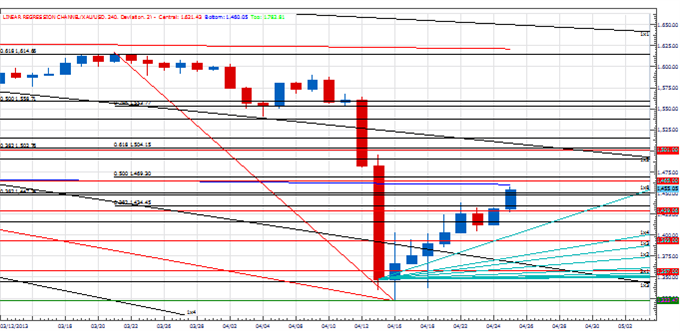
USD/CHF:
Charts Created using Marketscope – Prepared by Kristian Kerr
-USD/CHF has come under steady downside pressure since finding resistance at the 78.6% retracement of the March to April decline in the .9500 area
-Our bias is still higher in the cross, but strength over .9500 is needed to signal the start of a more important leg higher in the dollar
-Near-term focused time cycle analysis indicates a minor turn could be seen in the next couple of days
-The 1x1 Gann angle line drawn from the year-to-date low.9330 area is important support
-Weakness below the 4th square root progression from this year’s high near .9200 is really needed to turn us negative on the exchange rate
Strategy: Price action over the next few days will be important in determining the direction of the next meaningful move in the rate.
Focus Chart of the Day: Dow 30
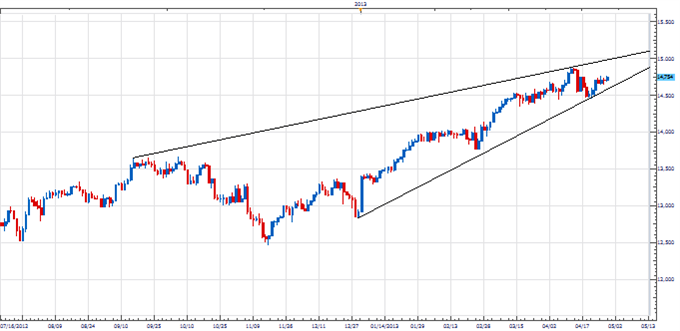
As we noted last week, the first half of this week is an important day for the markets from a time cycle perspective. A host of different time relationships in a variety of instruments are all converging around this time. Such “cycle confluences” are rare and more often times than not mark important turning points. The turn window looks particularly important to us for the US equity markets. With the indices trending strongly of late (in our opinion too much so given the concave nature of the ascent) and positive sentiment elevated and bordering on complacent the conditions seem ripe for a turn of some importance. In the sometimes bizarre world of cycle analysis, new highs during this time will actually be a negative for the market as that increase the possibility of a top. We will be looking closely for divergences among the SPX, Dow, Russell 2000, NYSE Composite and NASDAQ Composite over the next few sessions as such behavior is usually one of the early warning signs at the onset of a topping process. We should not that if the indices can somehow manage to circumvent the cyclical turn window and continue their advances unimpeded then that would be a very strong indication of more equity strength to come in the weeks and probably months ahead.
--- Written by Kristian Kerr, Senior Currency Strategist for DailyFX.com
To contact Kristian, e-mail kkerr@fxcm.com. Follow me on Twitter @KKerrFX
Are you looking for other ways to pinpoint support and resistance levels? Take our free tutorial on using Fibonacci retracements.
Need guidance managing risk on trades? Download the free Risk Management Indicator.
To receive other reports from this author via e-mail, sign up to Kristian’s e-mail distribution list via this link.


