From the table below, which lists the Oilers that have been invested in our recently started Natural Resources fund, one might have figured that these capital intense industry stocks would have fared worse as the Oil price sagged and, in fact, they did, just as now that the Oil price is rising so too are the Oiler stock prices.
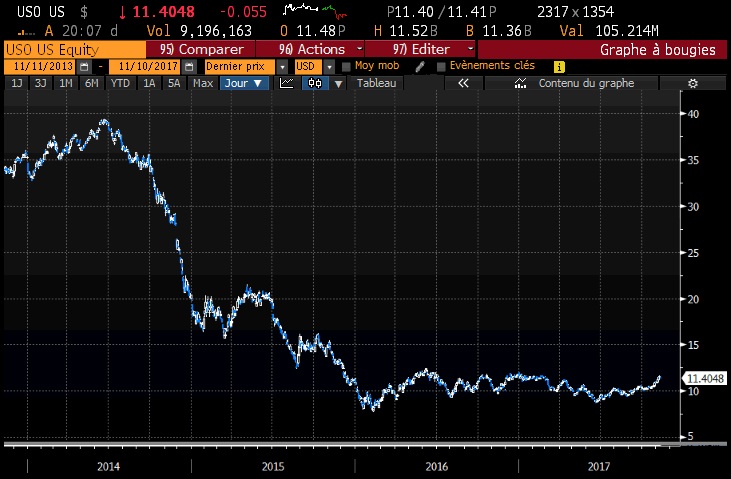
In fact, since the August 31 close, immediately before I opened our fund, USO is up +19.0% while the 14 Oilers we have been holding are up an average +35.7%.
.PNG)
Given that the Metal Miners in the fund have taken a substantial hit since August 31 (and actually since August 2016), our overall performance of +12.3% in just over two months is exemplary, particularly since we did not get deep into our buying program until mid-September and today we are about 30% in cash.
Why so much cash? Well, our job as portfolio managers is to manage risk by booking profits, especially abnormal profits. An average gain of +35.7% in just 10 weeks on 14 Oiler stocks is clearly atypical. In any case, our modus operandi is to be selling into strength and buying into weakness, and the four of 14 Oilers we sold through November 9 had profits running from over +30% to over +100%.
Getting back to the correlation point, investors understand the conceptual difference between price and value. The fact that prices rise and fall much faster than most any calculation of value is the underlying feature of capital markets trading. As you know, we trade prices, but we also try to invest in value, i.e., in what some people refer to as under-valued instruments.
On August 31, the narrative for Oil, which is the major driver for Oiler prices, was beginning to change from glut to shortage as drills were being shut down, from U.S. shale being a glut problem to one where shale wells were found to be depleting at a faster than anticipated rate, from noncompliance in the OPEC/Russia agreed production cut-backs to one where observers were starting to think the inventory rebalancing program is working, and so forth. The price of Oil soared. A rise of +19% in just ten weeks is a substantial move. Ergo, it is not surprising that many of the Oilers, most of which had been over-sold, would rally more than +19% in that period. However, an average gain of +35.7% is a bit over-done, I believe.
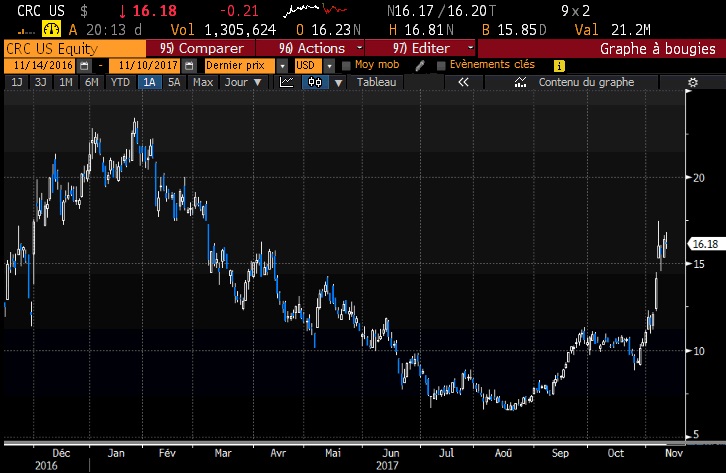
When California Resources Corp (CRC) rallied from $7.80 (August 30 close) to $16.39 (November 9 close), a gain of +110% in ten weeks, it should be the time for any trader to book profit. We happened to buy CRC at $7.81 on September 12 and sold it on November 7 at $16.32, which was a gain of +109% in exactly eight weeks. Now, if every trade would work that well... Of course, the trades in these four Oilers were aberrations and our losing trades in Gold and Silver Miners proves the point.
We bought Baytex Energy (BTE) on the NYSE on September 1 at $2.50 and sold it in the fund at $3.35 yesterday (November 9), which was a gain of +34.0% in ten weeks. You might recall that on September 1, we produced our report on Oil and the Oilers (that was written on August 30). We noted in that report that we also held BTE as well as MEG.TO and CJ.TO for SMA clients.
Two weeks later, the September 15 report went into BTE.TO and MEG.TO in more detail although these were never purchased for the fund.
Throughout this period, the price of most Oilers has been rising quickly. That will happen when the price of Oil is also rising quickly just as Oiler prices will fall more quickly than falling Oil prices.
There are many recently published articles that attribute the rise in the price of Oil to the OPEC/Russia agreement, which many people believe may be extended through 2018. That may be the case, but our thinking is that other factors are also at play.
Many of the smaller U.S. producers had been hedging i.e., selling future production at a fixed price of about $50 WTIC, where many wells can earn them a profit. Now that the price is at the $56-$57 level, these hedges are working against the hedged producers, so these sales have stopped, at least for now until the industry can get a better handle on the market. Less selling means upward pressure on Oil and Oiler prices.
Secondly, there are computer algorithms operated by the Humongous Bank & Broker crowd (HB&B) that serve to either increase or decrease money flows, which when it increases money flow is liquidity that the market needs and when it decreases is an action to control excessive liquidity. When prices rise too quickly as evidenced in the ten weeks since September 1, these algos are likely to start selling the Oil and Oiler prices lower, at least temporarily.
As we see it, there ought to be a period of selling next week, which has led to our decision to take profits where we think best in this portfolio this week. There may be a couple more orders filled by the close.
Yes, Oil and Oiler prices are highly correlated. However, when the price trend of the underlying commodity reverses from a long-cycle Bear to Bull, as it has, prices of the stocks will reverse and rise faster, particularly in the early weeks.
We took some profits, but generally we anticipate being invested in fully allocated Oiler positions soon. It is only a short time before the marketplace accepts that the $65 Oil price needed to sustain a healthy Oil industry is going to stick.


